Best Newport Beach surf window today: tide and conditions
Newport Beach's best surf window today is 11:30 PM-12:30 AM, with rising tide, 7 mph wind, and 3.1 ft swell; tide in range, light winds, good swell angle. Blackies is the top pick at 3 ft. For Newport Beach, separate the seasonal calendar from the live Blackies and jetty read before you commit.

Live surf planning
Plan around the live conditions
Best time to surf Newport Beach this week
September scores 87/100 on the San Pedro South buoy record. Every month scores within 10 points of July, the highest, so the buoy doesn't single out a season. Use this page for seasonality, but let the Newport Beach surf report own today's tide, wind, and board call.
Match the surf report
Start with the Newport Beach surf report for live tide, wind, Blackies context, and North Orange County backups before using this seasonal guide.

Buoy score v1
Buoy record for September
September
Buoy median 2.7 ft, typically 2.3–3.2 ft, at San Pedro South, 23.7 km from Newport Pier. Water 70°F. Highest month: July.
Newport's year on the San Pedro South buoy
Every month scores between 81 and 91 on the San Pedro South buoy record, so the buoy on its own doesn't pick a season. July scores highest, 91/100.
The buoy's monthly median reading stays between 2.6 and 3 ft all year.
Buoy score by month
Analysis by Quiver of NOAA NDBC station 46253 (CDIP 213) hourly observations, 2015–2025, 95,394 hours. Method buoy-v1. Station page
How the buoy score works
- 45%: share of days when the buoy's daytime median reached 2 ft
- 25%: share of hours with swell of 10 seconds or longer
- 20%: share of mornings (6–9 am) with offshore wind or wind under 6 knots
- 10%: how comfortable the median water temperature is
Method buoy-v1. Buoy scores can be compared with each other. The monthly scores on city pages without buoy data use an older method.
Download the monthly numbers (CSV)Month by month at the buoy
| Month | Buoy score | Buoy median (typical) | Days 6 ft+ | Days under 2 ft | Swell 10 s+ | Water | Wetsuit |
|---|---|---|---|---|---|---|---|
| January | 84 | 3 ft (2.3–3.9) | 14% | 15% | 84% | 60°F | 3/2mm sealed |
| February | 81 | 2.8 ft (2.2–3.9) | 16% | 14% | 74% | 59°F | 3/2mm sealed |
| March | 81 | 2.9 ft (2.3–3.8) | 12% | 14% | 73% | 59°F | 3/2mm sealed |
| April | 84 | 3 ft (2.5–3.8) | 9% | 5% | 67% | 60°F | 3/2mm sealed |
| May | 86 | 3 ft (2.5–3.5) | 5% | 3% | 71% | 63°F | 3/2mm fullsuit |
| June | 88 | 2.8 ft (2.4–3.3) | 1% | 3% | 73% | 66°F | Spring suit (2mm) |
| July | 91 | 2.8 ft (2.4–3.1) | 0% | 4% | 80% | 69°F | Spring suit (2mm) |
| August | 88 | 2.7 ft (2.4–3.1) | 0% | 7% | 73% | 70°F | Spring suit (2mm) |
| September | 87 | 2.7 ft (2.3–3.2) | 0% | 11% | 78% | 70°F | Spring suit (2mm) |
| October | 88 | 2.7 ft (2.3–3.3) | 3% | 12% | 84% | 68°F | Spring suit (2mm) |
| November | 84 | 2.6 ft (2.2–3.3) | 6% | 16% | 79% | 65°F | 3/2mm fullsuit |
| December | 83 | 2.8 ft (2.2–3.8) | 12% | 14% | 76% | 62°F | 3/2mm fullsuit |
Analysis by Quiver of NOAA NDBC station 46253 (CDIP 213) hourly observations, 2015–2025, 95,394 hours. Method buoy-v1. Station page
Why Newport's best days still come in summer
- 3 ft+ days, mostly south or southwest swell
- 3 ft+ days, mostly west or northwest swell
Analysis by Quiver of NOAA NDBC station 46253 (CDIP 213) hourly observations, 2015–2025, 95,394 hours. Method buoy-v1. Station page
The buoy's bigger winter days mostly come from the west. From December to February, 41% of days had a daytime median of 3 ft or more with swell mainly from the west or northwest. In July it was 4%.
South swell runs the other way. From May to October, 22% of days had 3 ft or more of swell mainly from the south or southwest, against 4% from December to February. Newport's beaches face southwest (217°), and the Wedge needs that south swell: it forms when south swell reflects off the harbor jetty.
So the buoy scores winter almost as high as summer, but the summer south-swell days are the ones Newport is built for.
How big the buoy reads each month
Analysis by Quiver of NOAA NDBC station 46253 (CDIP 213) hourly observations, 2015–2025, 95,394 hours. Method buoy-v1. Station page
Where the swell comes from
Direction the swell comes from at the buoy, as a share of hours in each season.
Analysis by Quiver of NOAA NDBC station 46253 (CDIP 213) hourly observations, 2015–2025, 95,394 hours. Method buoy-v1. Station page
Analysis by Quiver of NOAA NDBC station 46224 (CDIP 045) hourly observations, 2015–2025, 95,372 hours. Method buoy-v1. Station page
Wind by time of day
- Offshore
- Light (under 6 kt)
- Cross-shore
- Onshore
Each month shows dawn (6–9 am), midday (11 am–2 pm) and afternoon (3–6 pm), left to right.
Analysis by Quiver of John Wayne Airport (SNA) hourly weather observations from the Iowa Environmental Mesonet ASOS archive, 2015–2025, 96,051 hours. Method buoy-v1. Station page
Huntington and Newport against Dana Point
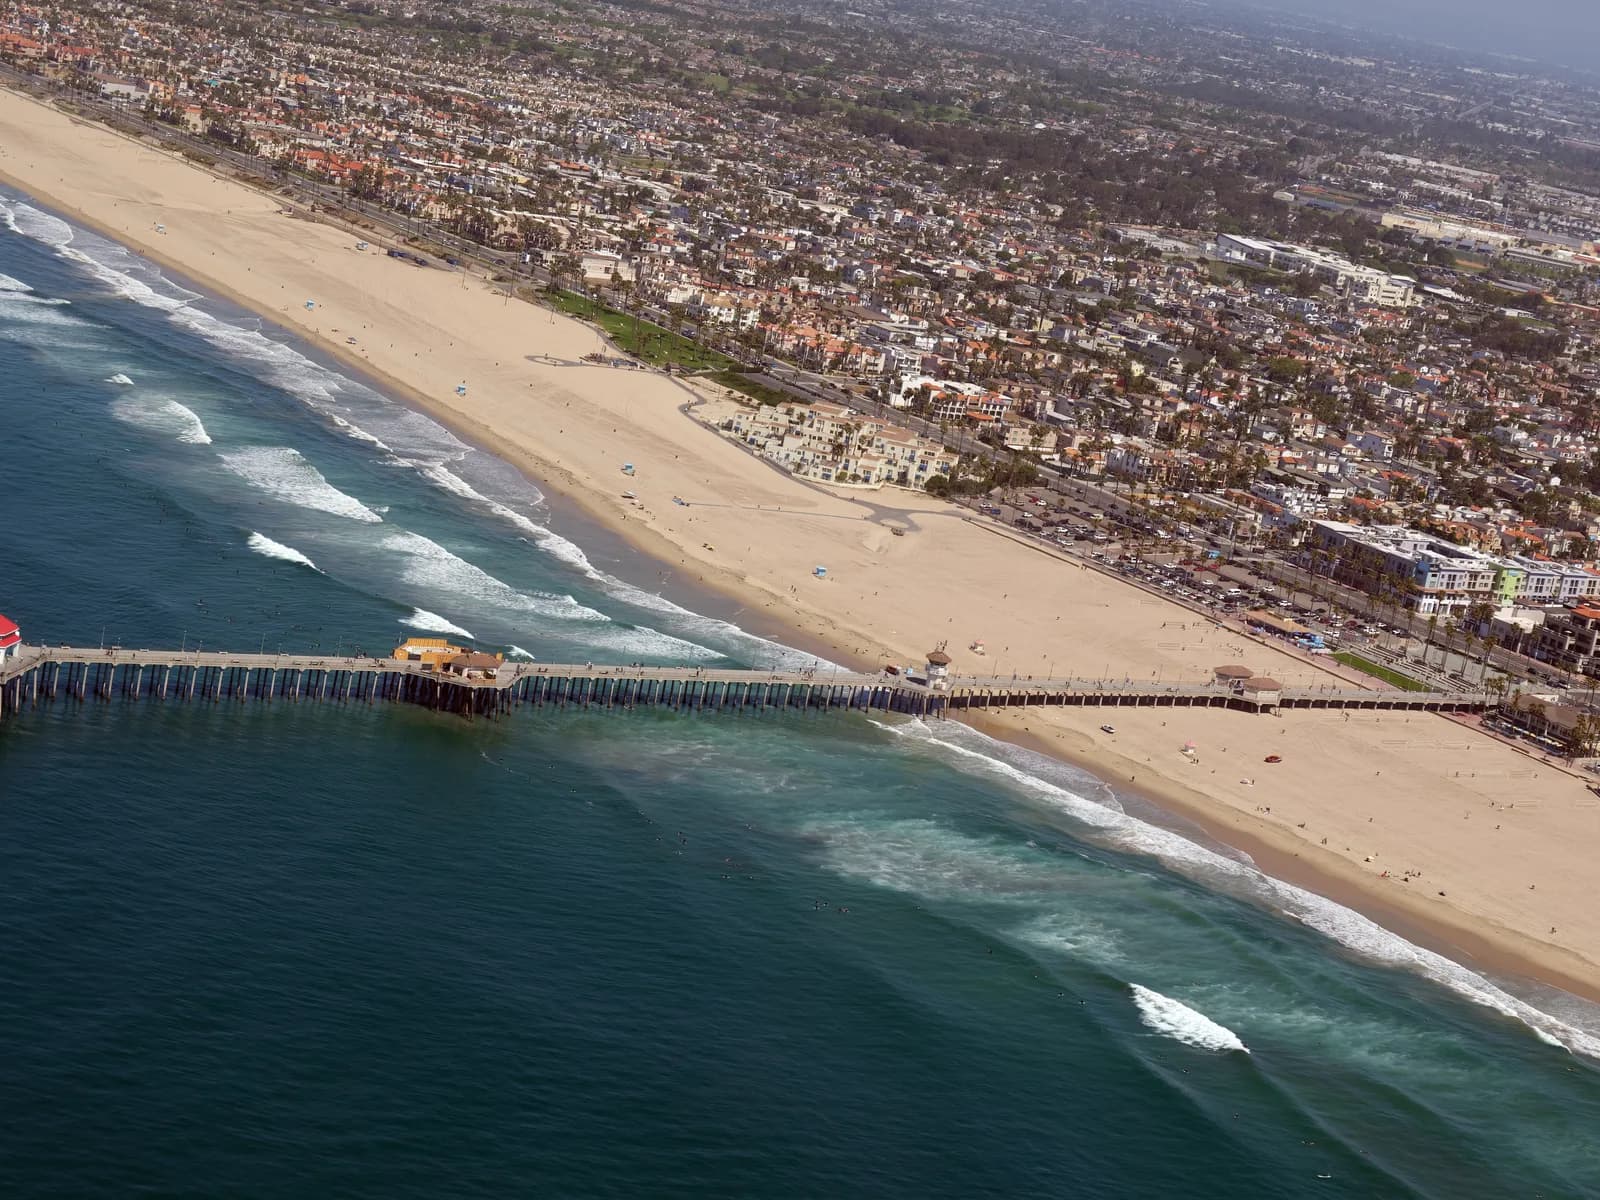
San Pedro South is 18.7 km from the Huntington Beach Pier and 23.7 km from Newport Pier, so it stands in for both. Oceanside Offshore, 36.8 km from Doheny State Beach, stands in for Dana Point and San Clemente. Both records cover 2015–2025.
From June to August, 75% of hours at San Pedro South had swell from the south or southwest, against 94% at Oceanside Offshore. From December to February, swell from the west or northwest made up 70% of hours at San Pedro South and 53% at Oceanside Offshore.
From June to August, 75% of hours at San Pedro South carried swell of 10 seconds or longer, against 92% at Oceanside Offshore.
Huntington Beach and Newport share one buoy here, so these numbers can't say which of the two is bigger on a given day.
Where these numbers come from
- A · Newport Pier
- B · Huntington Beach Pier
- C · Doheny State Beach
- 1 · San Pedro South (NDBC 46253): 23.7 km from Newport Pier, 18.7 km from Huntington Beach Pier, 48.4 km from Doheny State Beach
- 2 · Oceanside Offshore (NDBC 46224): 63.9 km from Newport Pier, 72.5 km from Huntington Beach Pier, 36.8 km from Doheny State Beach
- 3 · John Wayne Airport (SNA): 9.5 km from Newport Pier, 12.8 km from Huntington Beach Pier, 29.7 km from Doheny State Beach
Map © Mapbox © OpenStreetMap
Where the buoy and the beach part ways
The buoy reports significant wave height, which NOAA defines as the average height of the highest third of the waves it measures. San Pedro South sits 23.7 km from Newport Pier, and swell changes as it crosses shallower water and bends around headlands on the way in.
The Wedge, beside the Newport Harbor jetty, gets its shape from swell reflecting off the jetty. No buoy measures that.
Wind comes from John Wayne Airport, 9.5 km inland from Newport Pier. Wind at the beach can differ from the airport; the useful part is the timing of the afternoon onshore breeze.
