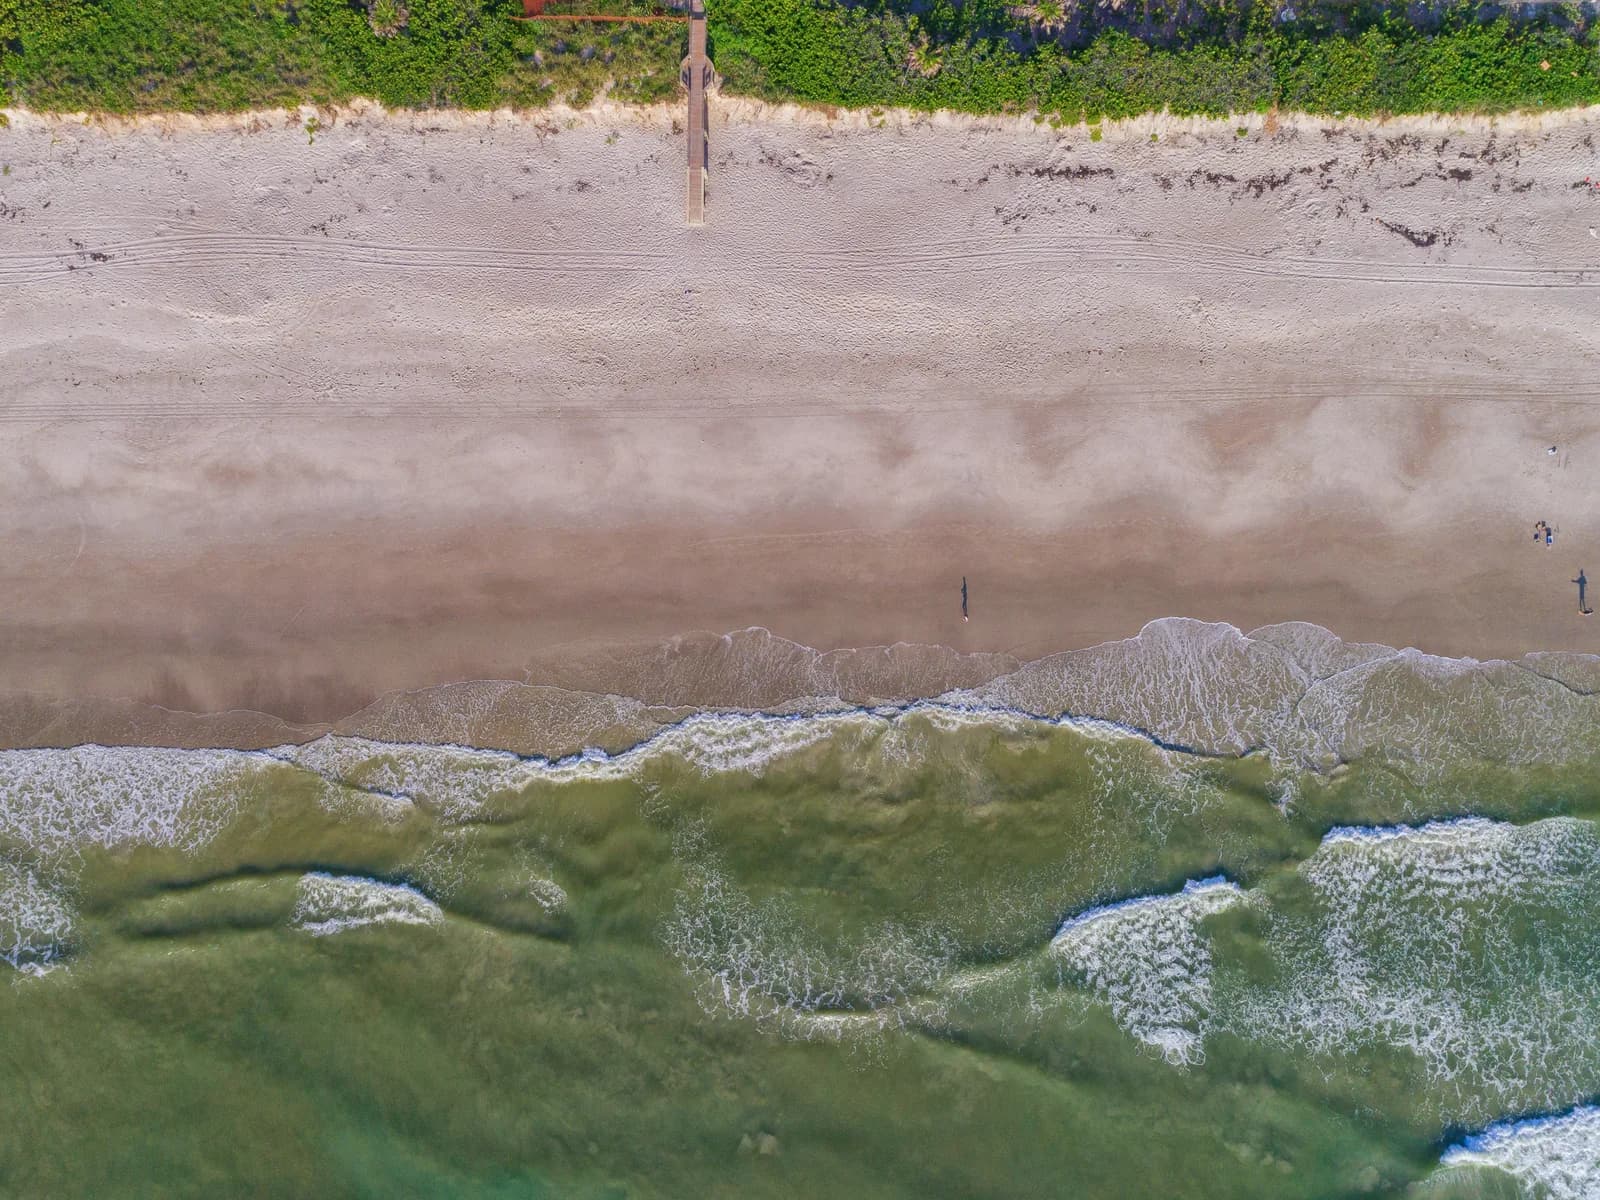
Best Cocoa Beach surf window today: tide and conditions
Cocoa Beach's best surf window today is 2:30 PM-3:30 PM, with falling tide, 5 mph wind, and 0.6 ft swell; tide in range, good swell angle. 16th St South is the top pick at 0.8 ft.

Live surf planning
Plan around the live conditions
Best time to surf Cocoa Beach this week
September scores 61/100 on the Cape Canaveral Nearshore buoy record. It's in the peak band, within 10 points of November.
Match the surf report
Now: falling tide, 10 mph wind, and 0.7 ft swell. Confirm them in the live surf report first.

Buoy score v1
Buoy record for September
September
Buoy median 2.2 ft, typically 1.7–2.8 ft, at Cape Canaveral Nearshore, 7.7 km from Cocoa Beach Pier. Water 84°F. Peak month: November.
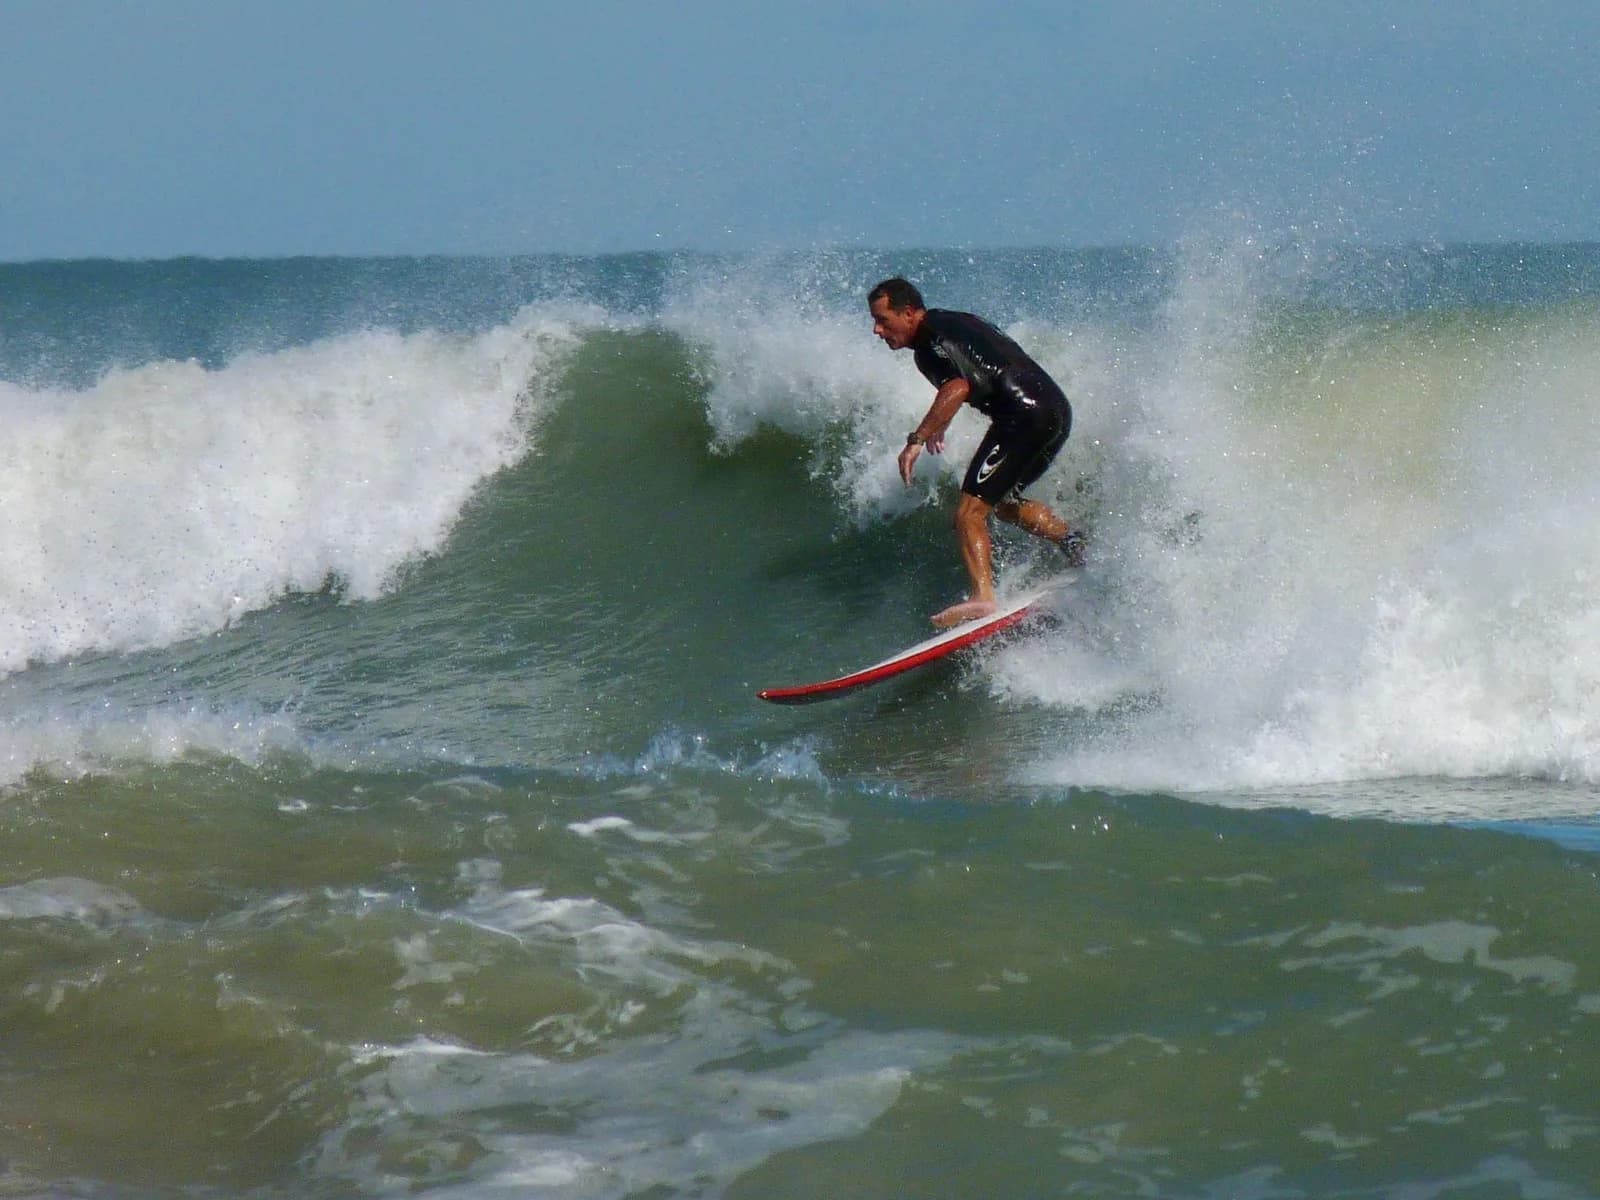
What 19 years of the Cape Canaveral buoy show
November scores highest on the Cape Canaveral Nearshore buoy record, 66/100. January, February, March, April, September, October and December are within 10 points of it.
In November the buoy's median reading is 2.8 ft. 4% of its days reached 6 ft or more in at least 3 hours, and 30% of its hours had swell of 10 seconds or longer.
July is the quietest month: on 84% of its days the daytime median stayed under 2 ft.
Buoy score by month
Analysis by Quiver of NOAA NDBC station 41113 (CDIP 143) hourly observations, 2007–2025, 154,365 hours. Method buoy-v1. Station page
How the buoy score works
- 45%: share of days when the buoy's daytime median reached 2 ft
- 25%: share of hours with swell of 10 seconds or longer
- 20%: share of mornings (6–9 am) with offshore wind or wind under 6 knots
- 10%: how comfortable the median water temperature is
Method buoy-v1. Buoy scores can be compared with each other. The monthly scores on city pages without buoy data use an older method.
Download the monthly numbers (CSV)Month by month at the buoy
| Month | Buoy score | Buoy median (typical) | Days 6 ft+ | Days under 2 ft | Swell 10 s+ | Water | Wetsuit |
|---|---|---|---|---|---|---|---|
| JanuaryPeak | 59 | 2.3 ft (1.6–3) | 2% | 40% | 32% | 67°F | Spring suit (2mm) |
| FebruaryPeak | 57 | 2.2 ft (1.6–2.9) | 0% | 42% | 29% | 66°F | Spring suit (2mm) |
| MarchPeak | 61 | 2.4 ft (1.8–3.1) | 1% | 35% | 34% | 70°F | Spring suit (2mm) |
| AprilPeak | 56 | 2.3 ft (1.7–3) | 1% | 39% | 23% | 74°F | Boardshorts |
| May | 52 | 2.1 ft (1.6–2.8) | 1% | 49% | 18% | 77°F | Boardshorts |
| June | 42 | 1.6 ft (1.3–2.2) | 1% | 75% | 15% | 80°F | Boardshorts |
| July | 37 | 1.5 ft (1.2–1.9) | 0% | 84% | 11% | 82°F | Boardshorts |
| August | 44 | 1.6 ft (1.3–2.2) | 1% | 72% | 19% | 83°F | Boardshorts |
| SeptemberPeak | 61 | 2.2 ft (1.7–2.8) | 3% | 45% | 43% | 84°F | Boardshorts |
| OctoberPeak | 61 | 2.5 ft (1.8–3.5) | 4% | 32% | 31% | 80°F | Boardshorts |
| NovemberPeak | 66 | 2.8 ft (2–3.7) | 4% | 23% | 30% | 73°F | Boardshorts |
| DecemberPeak | 61 | 2.4 ft (1.7–3.3) | 2% | 35% | 31% | 70°F | Spring suit (2mm) |
Analysis by Quiver of NOAA NDBC station 41113 (CDIP 143) hourly observations, 2007–2025, 154,365 hours. Method buoy-v1. Station page
How big the buoy reads each month
Analysis by Quiver of NOAA NDBC station 41113 (CDIP 143) hourly observations, 2007–2025, 154,365 hours. Method buoy-v1. Station page
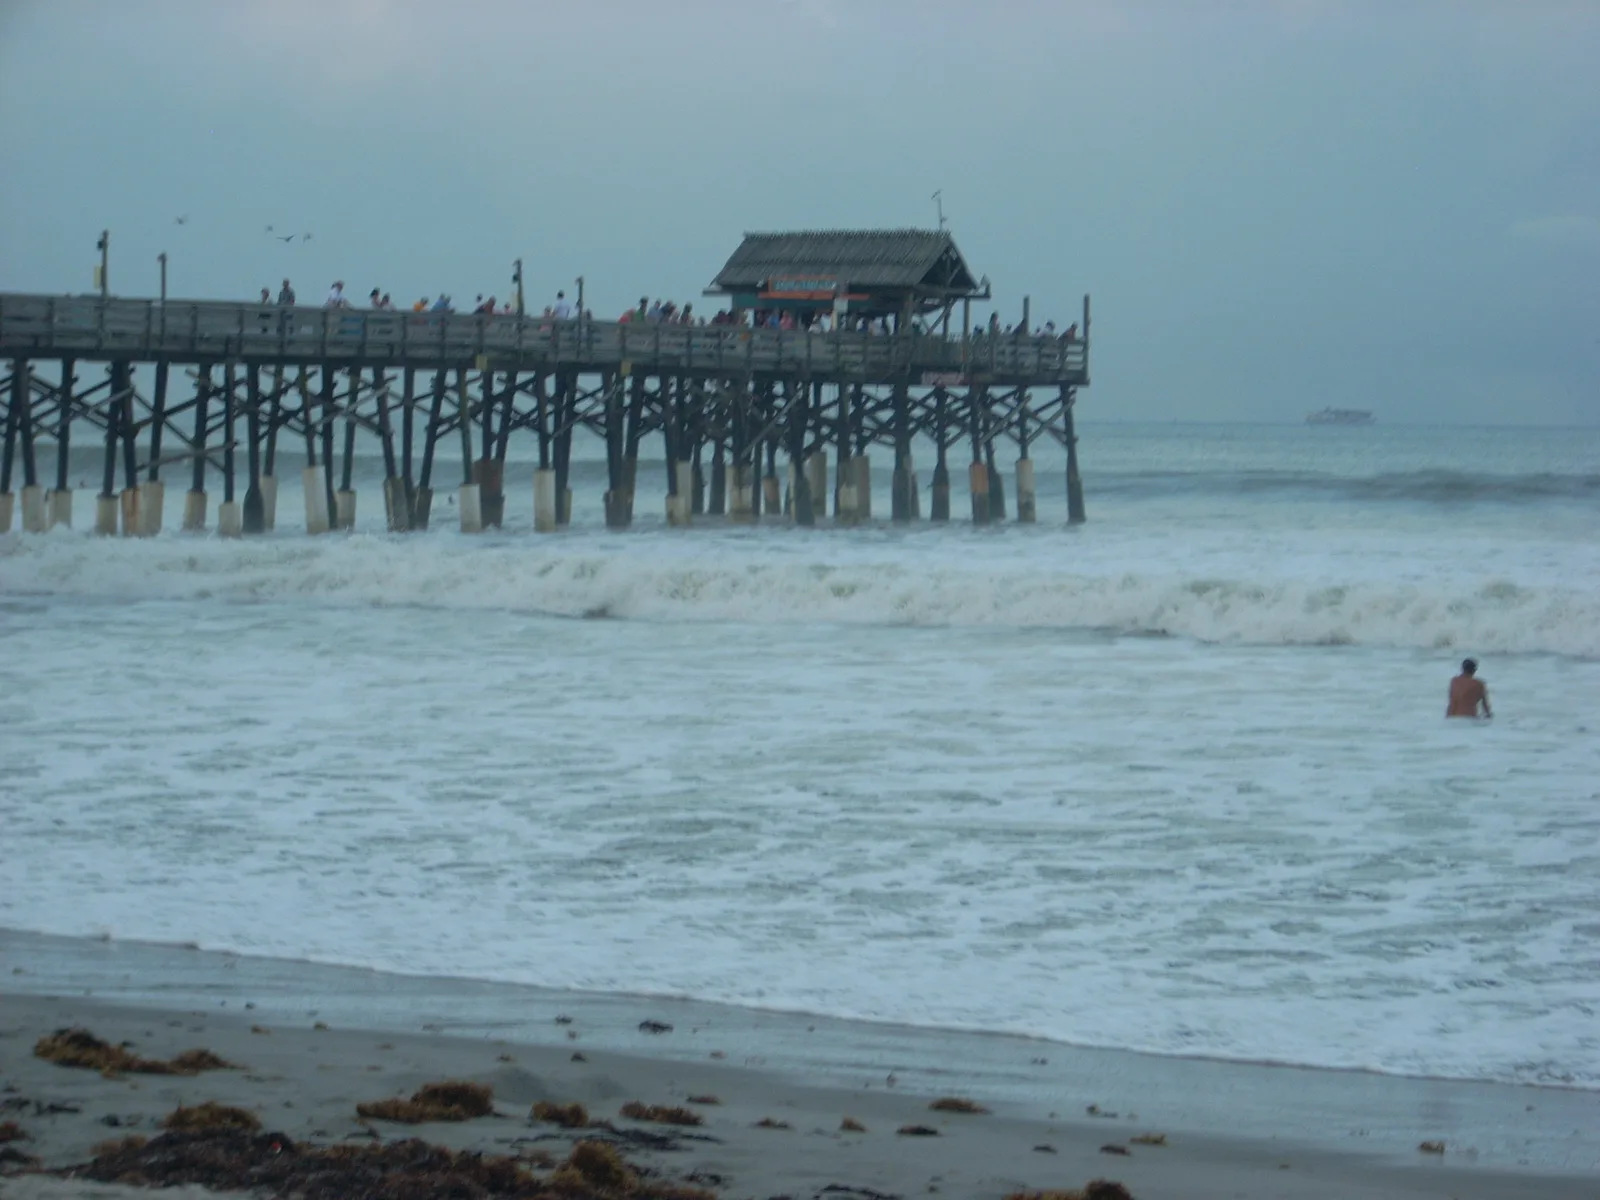
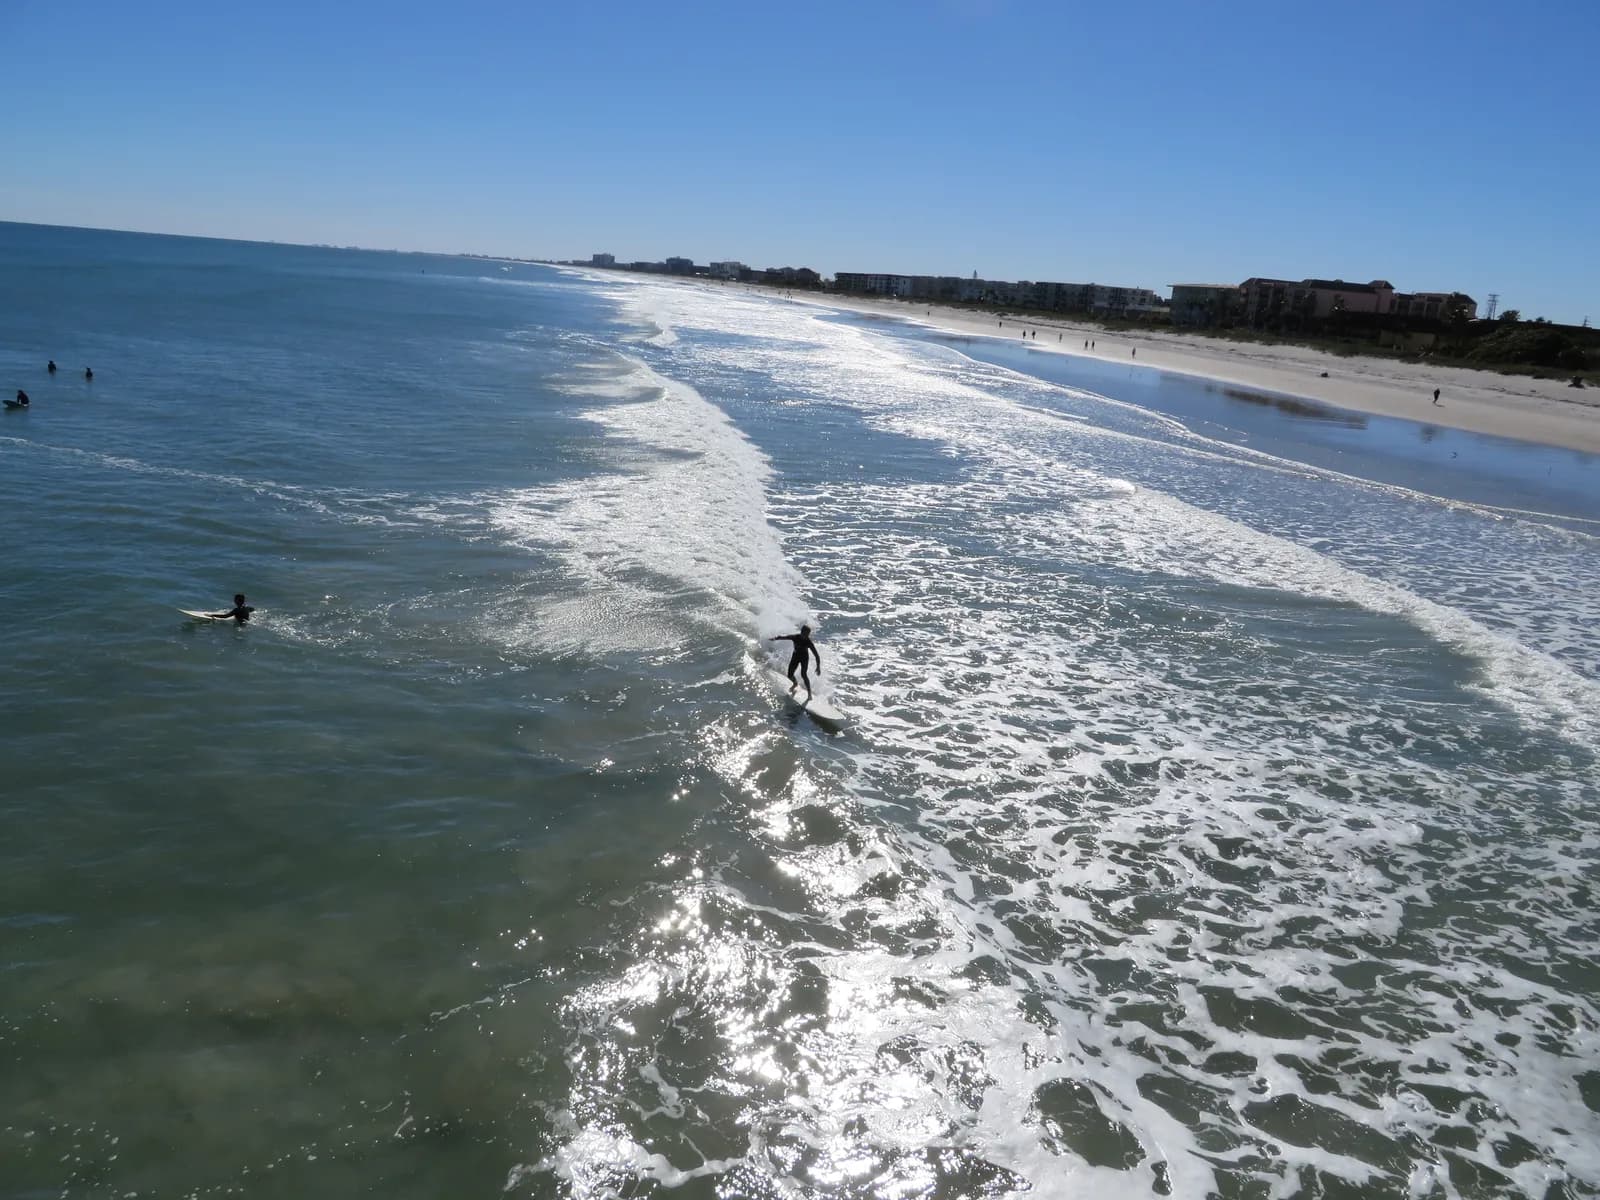
Where the swell comes from
Direction the swell comes from at the buoy, as a share of hours in each season.
Analysis by Quiver of NOAA NDBC station 41113 (CDIP 143) hourly observations, 2007–2025, 154,365 hours. Method buoy-v1. Station page
Wind by time of day
- Offshore
- Light (under 6 kt)
- Cross-shore
- Onshore
Each month shows dawn (6–9 am), midday (11 am–2 pm) and afternoon (3–6 pm), left to right.
Analysis by Quiver of NOAA NDBC station TRDF1 (CO-OPS 8721604) hourly observations, 2007–2025, 161,326 hours. Method buoy-v1. Station page
Satellite Beach on the same buoy
Satellite Beach is 26.1 km from the Cape Canaveral Nearshore buoy; the Cocoa Beach Pier is 7.7 km from it. The monthly numbers on this page stand for both beaches.
They can't tell you which beach is bigger on a given morning. That comes down to the sandbars in front of each one.
Where these numbers come from
- A · Cocoa Beach Pier
- B · Satellite Beach
- 1 · Cape Canaveral Nearshore (NDBC 41113): 7.7 km from Cocoa Beach Pier, 26.1 km from Satellite Beach
- 2 · Trident Pier (NDBC TRDF1): 5.5 km from Cocoa Beach Pier, 27.3 km from Satellite Beach
Map © Mapbox © OpenStreetMap
Months left out because the buoy recorded less than 70% of their hours: 2008-02, 2009-12, 2010-04, 2010-05, 2010-06, 2010-11, 2010-12, 2011-01, 2011-02, 2011-03, 2014-05, 2015-06, 2016-12, 2017-11, 2018-07, 2022-05, 2022-07, 2025-10, 2025-11.
What the buoy can't tell you about the pier
The buoy reports significant wave height, which NOAA defines as the average height of the highest third of the waves it measures. It measures the swell 7.7 km from the pier, before that swell reaches the sandbars.
Surf at the pier depends on those bars, and they move after big swells, so the same swell on the buoy can break differently from one month to the next.
Wind comes from Trident Pier at Port Canaveral, 5.5 km from the Cocoa Beach Pier.